• Guest, The HibeesBounce invites you to enter our Monthly Draw...

    Enter our Monthly Draw Here

    GGTTH

  • hibeesbounce

Covid -19 Graphs Scotland

View media item 384
Sobering graph showing the impact Covid -19 has had on the Scottish population ??????? in comparison with the expected 5 year average.

Each bar chart representing families and their loved ones rather than mere statistics.?
 
View media item 386
Scotland??????? not surprisingly very high up in all the tables where you really would prefer to be in relegation trouble.?
 
Good stats site here

 
View media item 393
An informative graph that summarises clearly the last few months for intensive care patients.
 
View media item 396
All good so far.✅
 
View media item 398
View media item 397

Top graph is number of tests per day in Scotland ??????? and bottom graph is number of people tested.

Probable correlation is people tend to get tested twice which makes sense though the numbers still look small though admittedly there won't be the same demands for tests that there was in peak April weeks.
Sat night Sun mornin and you're all over the case as ever. You really are an unsaveable statto arentcha? :)

FWIW you're doin a good job and know that your efforts are appreciated (an I dinnae even live in Scotland anymore).

In Other Dutch news, the new Corona database resource from the gov went online yesterday. Went off a few hours later as they had left a glaring security hole allowing even moderately techie visitors to view users' data in its entirety. They just had to iterate thru the actual db id keys in the url to view whole records one at a time (obviously they couldn't search, just swipe onwards as it were)

Nae doot millions of us taxpayers' dosh was 'disappeared' in the process :)
 
View media item 399
On the very happy day that Scotland ??????? announced zero deaths here is a snapshot of the country to date.
 
View media item 384
Sobering graph showing the impact Covid -19 has had on the Scottish population ??????? in comparison with the expected 5 year average.

Each bar chart representing families and their loved ones rather than mere statistics.?
It's an interesting chart. I note though that the past 5 year average is generally lower, out with the covid period, than the current year. This means that there must be a year with higher than normal deaths. That is a year where there were excess deaths. This suggests to me that for a true comparison we need to take that year out and view the current year against the others or see this year against each of the other years.

Edit, Just heard on the wireless that, this year, there have been fewer flu deaths than normal. So, that would suggest to get a true figure we would also have to take flu deaths out of the count...!
 
Last edited:
View media item 404
Not easy to read as the creator is trying a bit to hard but quite interesting once you get focus.

Wonder what happened in 1989.

Flu outbreak perhaps❓
 
View media item 404
Not easy to read as the creator is trying a bit to hard but quite interesting once you get focus.

Wonder what happened in 1989.

Flu outbreak perhaps❓

Registrars strike? It doesn't seem to carry on into 1990?

Also worth bearing in mind Scotlands population peaked in 1977 and dropped until 1989ish before increasing slightly and falling again before starting an upturn since 2003 to record level today.

Edit:


This would suggest you are right about flu epidemic.
 
Last edited:
20200617_185222.jpg
 

Care homes?

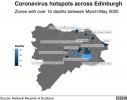
Did I see 65% of deaths in Midlothian were in care homes?

That’s a scandal
 
Care homes?

Did I see 65% of deaths in Midlothian were in care homes?

That’s a scandal
I'm sure I saw the national average was 47%. For some reason when I try to download the excel spreadsheet, where I think that information might be, I get kicked out back to my previous page.

 
View media item 408
Its been evident for a while in the raw numbers but this graph seems to show the benefit of maintaining lockdown.

I would be wary of it though as there is meant to be a 14/21 day lag before new deaths show.

It is true to say though that English ??????? politicians chose to unwind their lockdown earlier whereas Scotland ???????have managed to maintain a stricter lockdown for longer.

Its back to the old economy versus public he'alth arguments and the tough judgment calls politicians will have to continually juggle with as its a fine balancing act and no 100% correct strategy.
 
Last edited:
View media item 409
View media item 410

Scotland ??????? now very much in control of the Covid 19 virus at all levels from hospital admissions to patients in intensive care and with a reasonable testing structure in place.✔
 
View media item 411
I will pop this one here since the other thread seems to have gone down a different path but the timing of it made me smile.?

No sooner had the British Unionists led by Ruth Davidson had a go at the USA professor yesterday then she "coincidentally hits back" with a bit of a cherry picked graph.?

It isn't hard to see why they dislike her so much as she obviously has the First Minister ear by sitting on the Scottish ??????? advisory commitee and her advice has pushed Scotland down a slightly different lockdown path.
 
Last edited:
View media item 413
View media item 412
Its a little intrusive but the Scottish Goverment really does go out of its way to publish as many facts as possible about the Civic 19 pandemic.✔
 
View media item 415
The First Minister was sounding very bullish today at the daily press conference.

Graphs like this help.✔
 
View media item 415
The First Minister was sounding very bullish today at the daily press conference.

Graphs like this help.✔
I'm a bit dubious about that graph, how can a 7 day rolling average drop so much in one day?
 
View media item 416
More very positive news for Scotland??????? with both a high level of testing and a tiny percentage of positive tests.

This has been the trend now for a number of days.✅
 
View media item 420
View media item 421
More positive Scottish graphs??????? and Scottish government seem to be applying the test, test, test mantra.✅

As Scotland cant protect the borders then you have to assume they just let it run once USA flights ?? and English??????? and European camper vans arrive and then manage any fall out that results.
 
Last edited:
View media item 426
Contact tracing is a new graph though its hard to say if the numbers are good, bad or indifferent.

Its happening though which has to be another tool to defeat the spread.✅
 
Another day of no deaths in Scotland

 
View media item 427
Another positive graph showing that Scotland ??????? and the North of Ireland are very much on top of the situation.

Wales not so much.?
 
4 days running now

 
4 days running now


Tuesdays are always the big day. Fingers crossed.
 
View media item 429
View media item 428
Nice clear graphics here this time from the BBC.

I know its repetitive but these are clear well constructed graphs unlike many others so they deserve a mention.

It can't really be a surprise that you hammer testing and trace then after a time lag your number of cases begins to decline.

Flare ups and clusters will happen as will imported cases from travel and limited tourism which are still to come but Scotland??????? at the moment is in strong position to face these difficulties.
 
Last edited:
3 deaths

 
Some of those numbers look a little curious so I took a look at the Health Board level data. A few observations:
- The increase in hospital numbers comes wholly from suspected cases which are up by 147 (confirmed cases are down by 3).
- NHS Lothian suspected cases in hospital are the highest they've ever been at 238 (+91 on previous day). It's never been above 200 before. My suspicion is that there's some inconsistency in the definition of 'suspected' so these numbers should be taken with a pinch of salt.
- ICU patients in NHS Lothian have gone from less than 5 (they show an asterisk if a number is less than 5 so not sure what the exact number is) to 9 in the space of a day. Average has been around 6 ICU patients in NHS Lothian for the past month.
- No other health board has as many as 5 ICU cases.
- NHS Lothian has not had a positive test for Covid since 25 June (when there were 3)
- There was an increase of 10 positive tests since yesterday, of which 5 were in Dumfries and Galloway (they've not had a positive test since 20 June prior to that, wonder if it's just delayed reporting or is there an indication of a localised spike down that way?).
 
View media item 430
Its not easy to read these graphs but once you get the hang of it then its very much positive news across the whole of Scotland.

The daft spike at the end is because of a lag in cases now added last week from a different testing method so they are old cases rather than new.✅
 
Some of those numbers look a little curious so I took a look at the Health Board level data. A few observations:
- The increase in hospital numbers comes wholly from suspected cases which are up by 147 (confirmed cases are down by 3).
- NHS Lothian suspected cases in hospital are the highest they've ever been at 238 (+91 on previous day). It's never been above 200 before. My suspicion is that there's some inconsistency in the definition of 'suspected' so these numbers should be taken with a pinch of salt.
- ICU patients in NHS Lothian have gone from less than 5 (they show an asterisk if a number is less than 5 so not sure what the exact number is) to 9 in the space of a day. Average has been around 6 ICU patients in NHS Lothian for the past month.
- No other health board has as many as 5 ICU cases.
- NHS Lothian has not had a positive test for Covid since 25 June (when there were 3)
- There was an increase of 10 positive tests since yesterday, of which 5 were in Dumfries and Galloway (they've not had a positive test since 20 June prior to that, wonder if it's just delayed reporting or is there an indication of a localised spike down that way?).
I've had another look at the "suspected cases in hospital" data and I reckon it's definitely a bit pointless. According to the data files, ambulances are taking around 150 suspected Covid cases to hospital every day - so I think their definition of "suspected Covid" probably includes anyone displaying any of the known symptoms. So basically I reckon if you have a high temperature you'd be classed as "suspected Covid" under that measure. Anyone who's classed as suspected Covid probably stays classed as that until they've had a negative test result back (which presumably the vast majority do). So the big fluctuations in suspected cases are probably just to do with the administration of tests and the timing of updating the results when they come back in.

The confirmed cases in hospital have dropped by 11 today, which continues the downward trend. The split of the 8 new cases in today's data is Greater Glasgow & Clyde - 5, Dumfries & Galloway - 1, Grampian - 2. So another day with no positive cases in Lothian.
 
View media item 432
Another very informative graph showing how far Scotland ??????? has come particularly in the densley populated central belt.

Its also noticeable how well the people of London??????? have done given this was the epicentre of the virus in the early days.✅
 
View media item 432
Another very informative graph showing how far Scotland ??????? has come particularly in the densley populated central belt.

Its also noticeable how well the people of London??????? have done given this was the epicentre of the virus in the early days.✅
London's R number is now above one.
Just as the pubs , cinemas etc open
Could be a recipe for disaster.
 
View media item 436
View media item 435
There seems enough evidence around to show that Scotland's??????? strategy of test, trace, isolate and then to contact potential carriers is functioning to a high enough standard to move to the next level.

That next level will be cluster outbreaks or super carriers via unprotected borders or dafties on a staggy.?

It gives Scotland's ??????? policy of eliminating the virus not merely controlling it a fighting chance ✅
 
View media item 440
View media item 439
Nothing very new here but its a source of information that had not been loading properly for few weeks (for me anyway?).

Good to have it back.✅.

If you look at intensive care v hospital admissions over time it seems to indicate that the bar is now much lower about admitting patients to hospital.

In April 2020 1,800 patients were admitted of which 200 were in ICU. By July there was 700 patients in hospital? only 15 who were in ICU.

Next stage in this pandemic will be clusters and surges going by the experience of other countries so hopefully the graphologists and modellors develop visual aids to help understanding.
 
Last edited:
View media item 442
Financial Times with an interesting story but its behind a paywall.?

Its back to the bigger picture rather than just England??????? though as once international travel particularly USA opens?? up then Edinburgh and Glasgow airports just become transit stops for the virus to return.

I wonder if Scotland??????? has any real powers at all to police its own airports which is quite a bizarre question in itself.?
That particular article isn't behind the paywall


Not really sure what I think of this but thought I'd post here anyway seeing as it fits the bill of being a graph about Covid!

I suppose the hypothesis for Scotland, if the correlation is valid, is that a low number of vulnerable people lost their lives during the traditional flu season, leading to a higher number of people still being around who were particularly susceptible to Covid.
 

This thread has been viewed 169918 times.

Your donation helps pay for our dedicated server and software support renewals. We really do appreciate it!
Goal
£100.00
Earned
£47.50
Back
Top